
04Module · Enterprise Architecture
Understand your IT landscape.
And reshape it deliberately.
Which applications support which capability, who owns them and where is your IT doing the same work twice? knooing links portfolio, capabilities and business processes and turns overlaps into concrete retirement projects.
What this module delivers
Five building blocks. One map of your IT.
01Portfolio analysis
Every application, owner and user at a glance.
Instead of scattered spreadsheets you get one source of truth: which applications run, who owns them, which departments use them and which business processes depend on them. Contracts, licenses and vendors are attached to every app.
- Application, owner, user groups, departments and status in one view
- Linked contracts, licenses and vendors per app
- Change history: who changed what, when (audit log)
- Tags, cost categories and regions for filtering and segmentation

02Capability map & business processes
A shared language between IT and the business.
Capabilities and business processes form the functional layer above your IT. Every application and service is linked to a capability – so you can see where functionality is covered, where it is missing and where it overlaps.
- Multi-level capability map as a shared model
- Business processes linked to supporting applications and services
- Heatmap view: how strongly is each capability covered?
- Direct bridge to the overlap matrix for consolidation decisions
03Overlap matrix
Surface functional overlaps between applications.
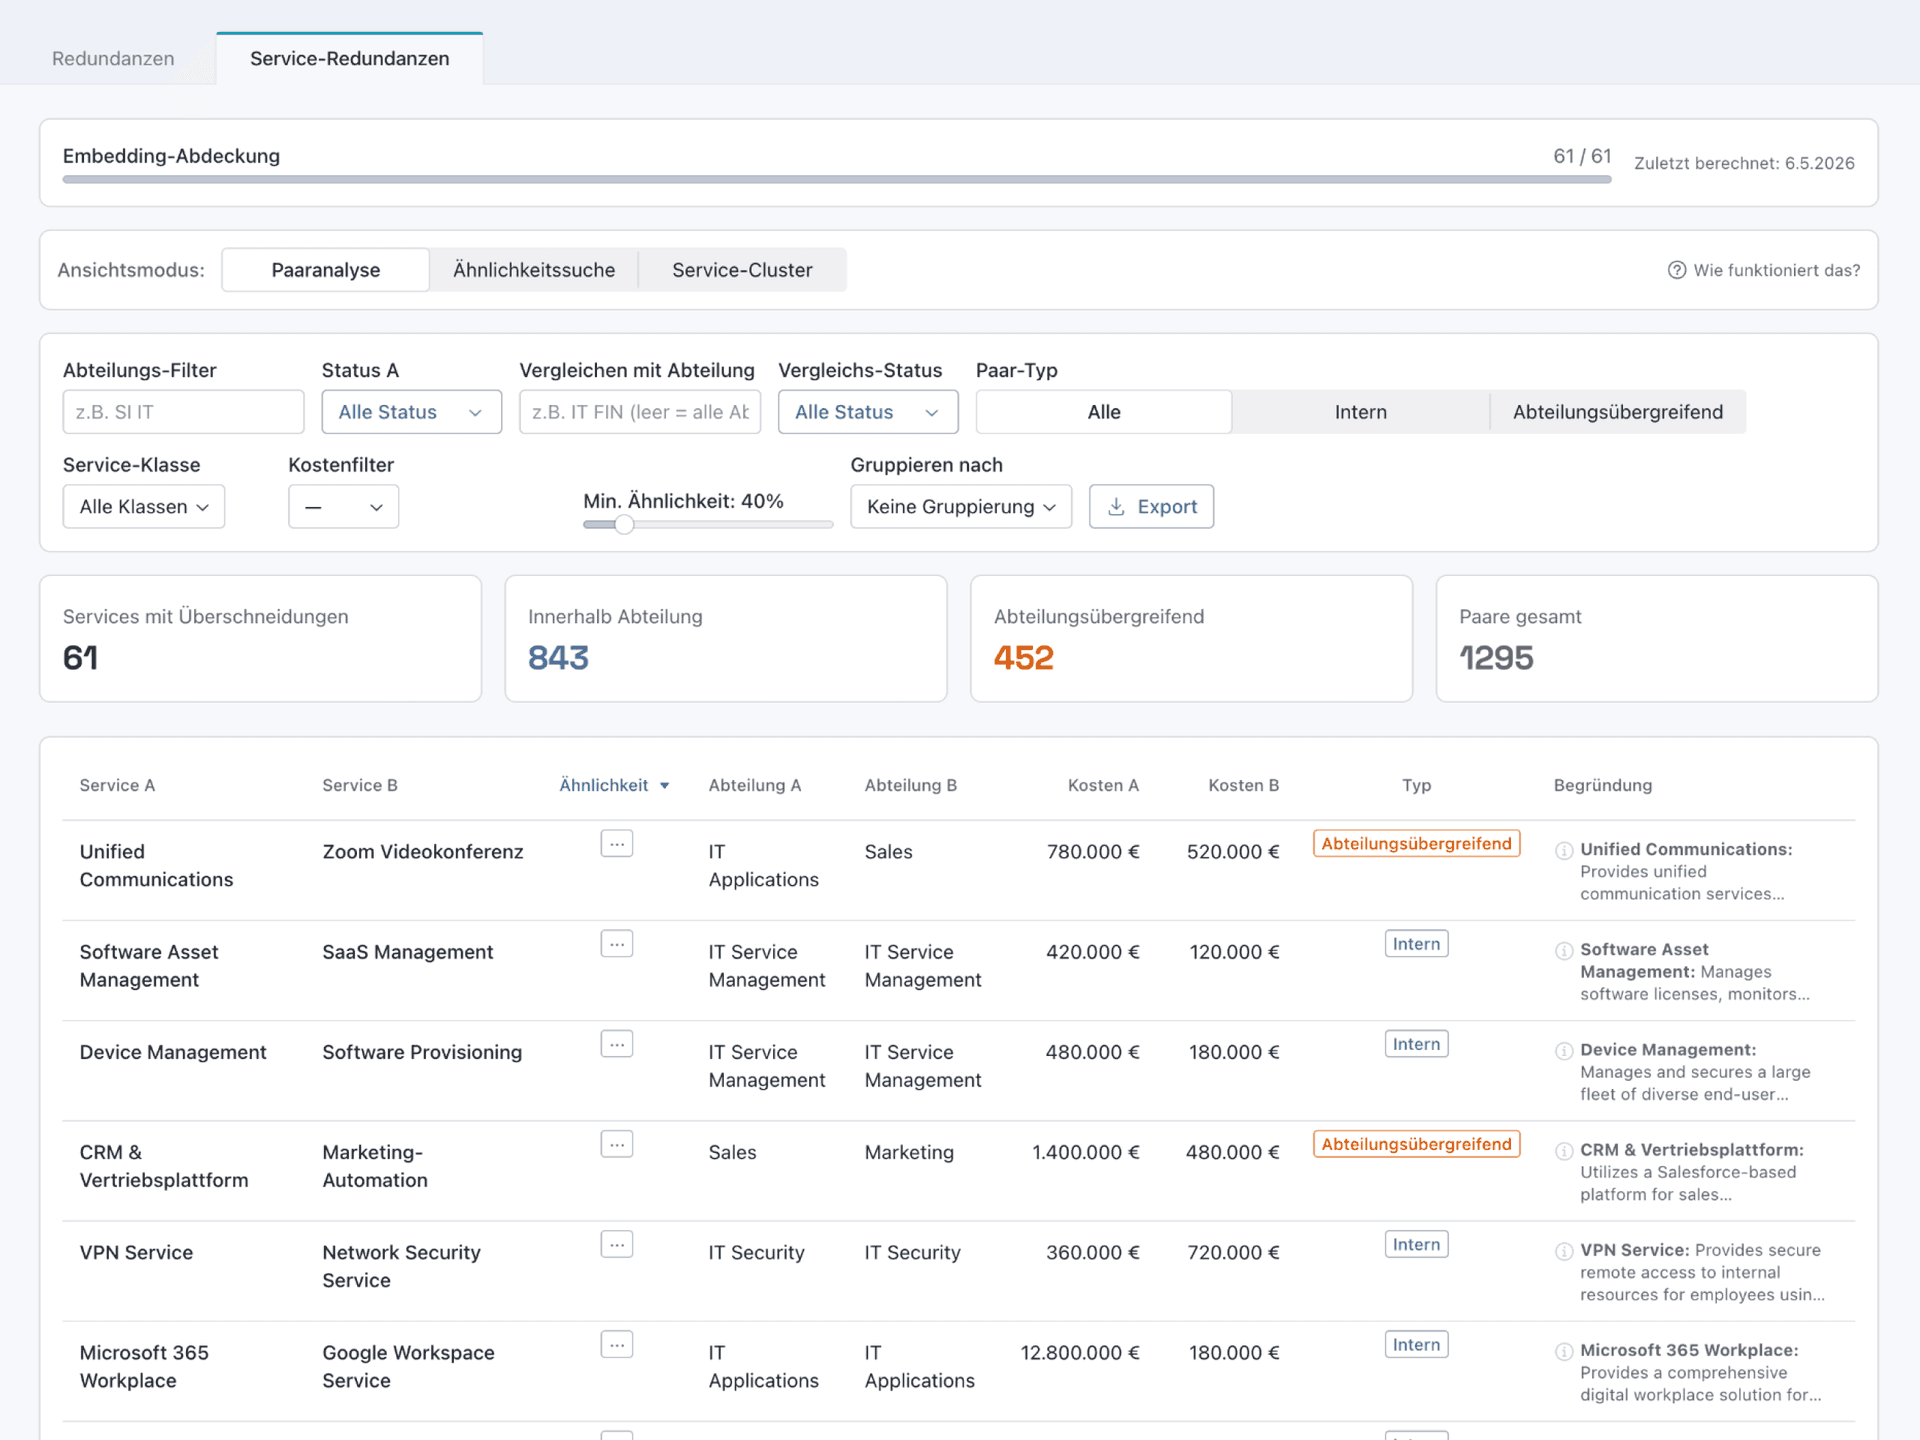
Every application is compared pairwise against your capability model. Wherever multiple tools cover the same capability, you get a consolidation candidate – as a heatmap and a prioritised list with quantified savings.
- Heatmap view: how many tools cover the same capability?
- Pair detail view with functional overlap score
- Direct link to costs per candidate
- Export as a discussion basis for business units

04Fingerprint matrix
Automatically group technically similar systems.
From data classification, interfaces, hosting, identity provider and compliance requirements a fingerprint is built per application. Applications with high fingerprint similarity are plausible candidates for technical consolidation.
- Per-app fingerprint built from technical attributes
- Similarity clusters with an explainable score
- Indicator: how expensive would a technical consolidation be?
- Combinable with the overlap score for a holistic view

05Optimization Projects
From finding to action — with ownership and status.
Every detected redundancy becomes a concrete optimisation project: with savings potential, migration effort, owner, target date and status tracking. The result is a running pipeline instead of a one-off report.
- Project backlog with quantified savings
- Effort/value matrix for prioritisation
- Owners, target dates, status, comments
- Realised savings show up in the Value Dashboard
Make data-driven IT decisions in minutes, starting today.
Schedule a free, no-obligation demo